Color scanner characteristics test (below)
2024-02-24 09:07:49
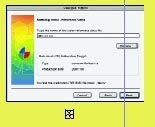
2) When the Read Reference Data dialog box appears, enter the file name containing the reference data in the input box. You can also click the "Browse" button to find the reference data file (see Figure 2).
3) Click on the "Next" button and the Read Calibration File dialog box will appear. Read the IT8 calibration scan image Tiff (RGB) data file.
The calibration scan data is displayed in the form of color patches with smaller white patches above them, which represent the measurement and evaluation area. The white square must be in the center of the colored square (see Figure 3).
If the calibration scan is skewed and the measurement grid does not cover all color patches, the calibration draft must be re-scanned.
4) Click on the "Next" button and the Properties File Calculation Options Settings dialog box will appear (see Figure 4).
1 Select the Profile option: Select Color when using a color scanner; Gray when using a black and white scanner.
2 Select the Optimization option:
Standard, in most cases, this option, especially for scanners using the Linocolor scanning software. In Linocolor, density analysis is performed before the original is scanned.
Static Range, use this option for scanners without density analysis.
Darken Shadow, use this option for scanners that are difficult to scan image darkness (not enough resolution).
Lighten Shadow, select this option for very dark originals. Correct the dark tone when calculating the profile.
3 Select the Quality/Size option:
Good (small profile); very good (property file); excellent (large profile).
Depending on the options, the required processing time, profile size, and quality will vary. That is, the accuracy of the calibration will be different.
5) Click on the "Next" button. The Calculate and Store Properties dialog box will appear (see Figure 5). The calculation process can be monitored from the progress indication. And shows the number of steps calculated, the average error, and the quality of the calculation.
The smaller the average error, the higher the calibration quality. If the average error is less than 1.0 and the quality is less than 0.3, then a good calibration is obtained.
6) Check and modify the profile description text.
The text box automatically displays the following: ICC calibrating the manuscript manufacturer (eg Kodak); the type of manuscript (T=Transmission transmission; R=Reflective reflection); the time when the manuscript was produced (eg 1995_06 on behalf of June 1995); scanner name (eg TOPAZ).
This profile description text is stored along with the ICC scan profile. Some applications and systems use this description instead of the file name when selecting an ICC profile. Therefore, it is recommended that the file name of the storage profile be the same as the descriptive text here.
7) Click the "Save As" button to save the profile. At this point, the original "Next" button in the Scanopen Wizard dialog box changes to "Finish" (see Figure 6). If you do not need to create another ICC profile, click the "Finish" button to complete the Scanopen program wizard and complete the ICC profile generation of the scanning device.
Source: Ke Yin Network
Flip Chart,Magnetic Mobile Flip Chart,Alloy Flip Chart,Magnetic Flip Chart
Jiangyin Europtronic Stationery Co., Ltd. , https://www.youpuwhiteboard.com